Erik Wagner · 4 October 2026
Mapping Tidal Moisture Patterns to Guide Species Selection in Shifting Coastal Habitats
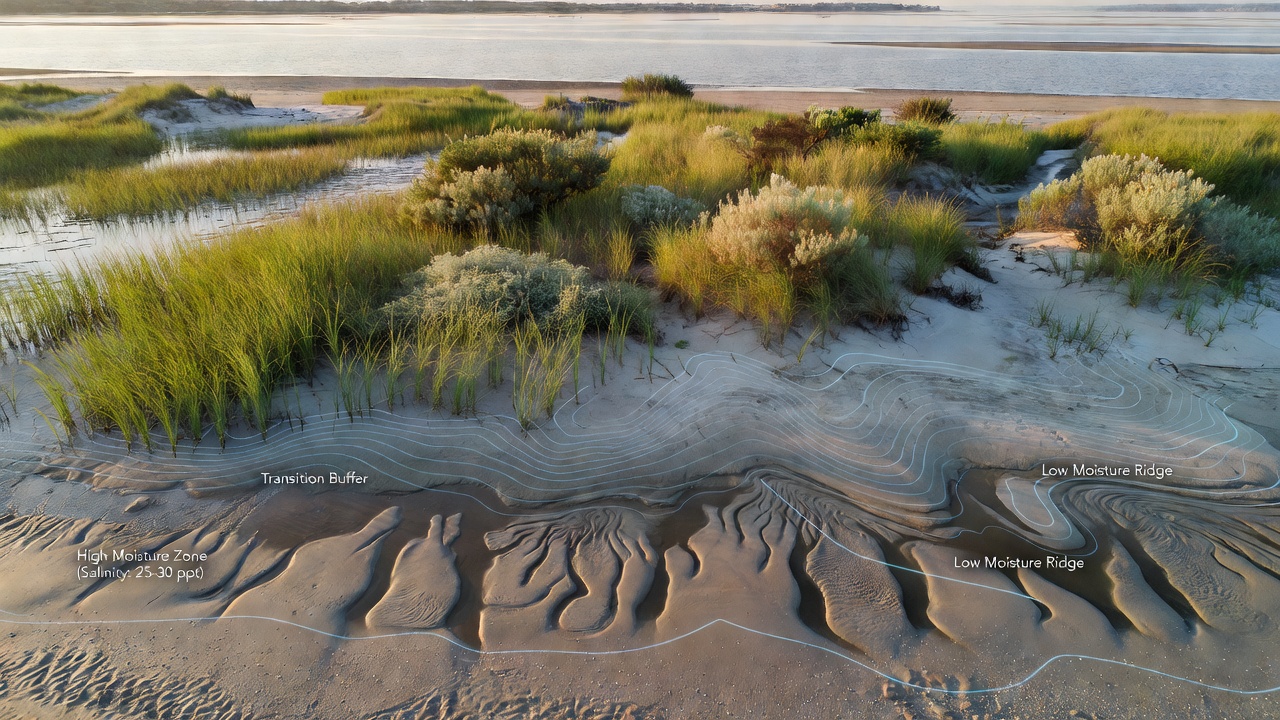
Coastal habitats experience constant shifts driven by tides, storms, and rising sea levels, which create variable moisture and salinity gradients that influence plant survival. Researchers map these tidal moisture patterns to identify suitable species for restoration projects and habitat management. Data from field measurements combined with satellite imagery reveal how water retention changes across zones from high marsh to foredune areas, allowing precise matching of plant traits to local conditions.
Core Processes Behind Tidal Moisture Variation
Tidal cycles deliver saltwater intrusion at predictable intervals while evaporation and rainfall alter soil moisture between events, and this interplay produces distinct bands where certain plants thrive. Studies in dynamic shorelines show that moisture levels can fluctuate by 30 to 50 percent within a single tidal cycle in sandy substrates, creating narrow windows for seedling establishment. Observers note that finer sediments retain water longer, extending the period of saturation and raising salinity stress for less tolerant species.
Mapping begins with deployment of soil moisture probes and conductivity sensors placed at multiple depths along transects that run perpendicular to the shoreline. These instruments record hourly readings over several months to capture both spring and neap tide influences, while GPS coordinates tie each data point to elevation models derived from LiDAR surveys. Geographic information systems then interpolate the readings into continuous moisture maps that highlight transition zones where conditions shift rapidly.
Integrating Data for Species Matching
Once moisture maps exist, ecologists overlay them with known tolerance ranges for native coastal plants such as Spartina alterniflora in lower zones and Ammophila breviligulata in drier upper dunes. One project along the mid-Atlantic coast demonstrated that selecting species according to these mapped patterns increased survival rates by 40 percent compared with uniform planting approaches. The process accounts for seasonal changes because fall and winter storms often redistribute sediment and alter drainage patterns that affect spring growth.
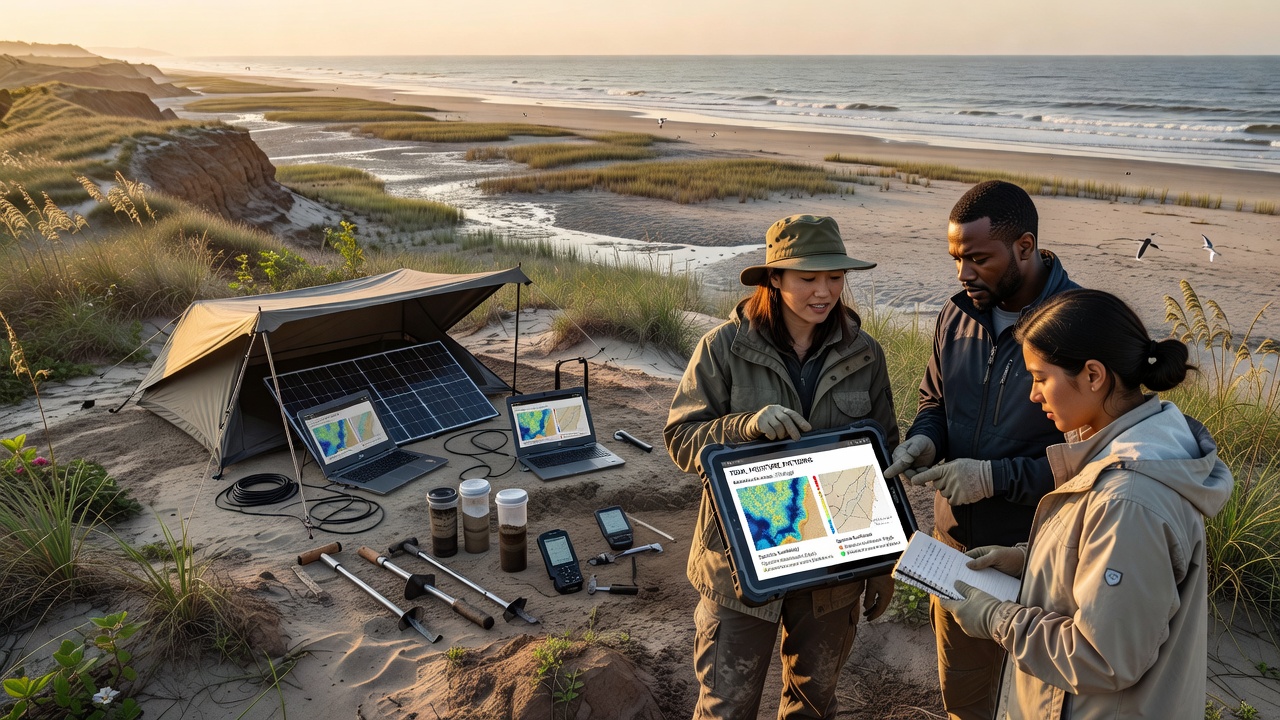
Remote sensing adds another layer through multispectral imagery that detects vegetation stress indicators linked to moisture deficits or excess salinity. Algorithms trained on ground-truthed data distinguish between areas experiencing chronic waterlogging and those with rapid drainage, and this classification helps planners avoid placing deep-rooted shrubs in zones where high water tables would cause rot. In October 2026, several long-term monitoring networks continue to release updated datasets that refine these models for regions experiencing accelerated shoreline retreat.
Practical Applications Across Regions
Coastal managers in different countries apply similar mapping frameworks adapted to local sediment types and tidal ranges. Australian researchers at CSIRO have documented how mapping tools guide selection of salt-tolerant grasses in areas affected by altered river flows, whereas projects in the Pacific Northwest of North America focus on integrating moisture data with sediment accretion rates to support eelgrass restoration. These efforts rely on open data portals maintained by agencies such as NOAA that provide standardized tide and water level information for calibration.
Shifting habitats introduce additional complexity because storm events can reshape topography overnight, rendering previous moisture maps obsolete. Teams therefore schedule repeat surveys after major weather episodes and use drone-based thermal imaging to detect changes in surface moisture without disturbing sensitive areas. The resulting updates feed directly into adaptive management plans that adjust species lists for the next planting season.
Challenges and Refinements in Current Practice
High-resolution mapping requires substantial field effort and equipment investment, yet the return comes through reduced replanting costs and improved ecosystem function. Some programs combine citizen science observations with professional sensor networks to extend coverage across larger stretches of coastline while maintaining data quality through standardized protocols. Evidence from multiple sites indicates that moisture pattern maps also help predict invasion risk because certain non-native species exploit transitional zones where native plants struggle during drought periods between tides.
Future refinements include coupling moisture models with sea-level rise projections to anticipate how today's suitable zones will migrate inland over coming decades. This forward-looking approach allows land managers to prioritize acquisition of buffer areas and begin establishing appropriate species before conditions change dramatically.
Conclusion
Mapping tidal moisture patterns supplies a factual foundation for choosing plant species that match the physical realities of shifting coastal habitats. Continuous data collection and integration with elevation and salinity information enable restoration efforts to achieve higher establishment success across variable shorelines. As monitoring networks expand and analytical tools improve, these methods support more resilient coastal ecosystems that withstand ongoing environmental pressures.